


Tightening regulatory scrutiny, risks due to volatile markets, and structural inconsistencies is compelling more businesses to adopt a GRC framework. However, it is only effective when you have actionable, data backed indicators of your compliance and risk efforts.
GRC programs today are often geared towards audit readiness or compliance certification. Teams end up focusing on activities rather than the effectiveness.
Lets break down the a, b, and c’s of GRC metrics analysis.
What are GRC metrics? Why should you analyse them?
GRC metrics are the data quantifiers used to track, refine, and measure your business’s compliance progress, risk efforts, and governance initiatives.
These metrics provide precise insight into risk levels, audit gaps, progress to framework certification, and security practices. These insights help you make better risk decisions and identify areas of weaknesses.
As your business grows, regulatory obligations, risk landscape, and internal processes continuously change. Your existing measures, controls, and strategies are likely to become ineffective over time. Analysing GRC metrics show what’s working and what’s failing.
What to measure: breaking down the GRC trio
To measure your GRC metrics, you’ll need to track each component: governance, risk, and compliance. Despite being interconnected, each serves a distinct purpose. Together, these demonstrate if your GRC program is actually functioning the way it should.
Governance metrics
These evaluate how well the internal structures, compliance policies, and oversight systems are functioning. Governance metrics you should evaluate:
- Policy coverage rate (percentage of processes/assets governed by policies)
- Policy review and update frequency (timeliness of governance updates)
- Policy exception rate (how often policies are bypassed)
- Board and committee meeting frequency and attendance
- Time to decision on critical risk/compliance issues
- Alignment of policies to regulatory requirements and business objectives
- Ownership clarity (percentage of controls/policies with assigned owners)
- Internal audit coverage of areas reviewed vs total risk universe
- Issue escalation rate and resolution timelines
- Training and awareness completion rates (by role/function)
- Governance maturity score (based on framework adoption)
Risk metrics
Risk metrics quantify how your organization’s exposure to potential threats and the effectiveness of your controls to manage them. Risk metrics you should evaluate:
- Number of identified risks by category and severity
- Risk likelihood and impact scores (inherent vs residual risk)
- Risk heatmaps and trend analysis over time
- Number of high/critical risks exceeding thresholds
- Time to detect and respond to risks
- Risk acceptance vs mitigation ratio
- Emerging risk indicators like e.g., new vendors, new systems, regulatory changes
- Third-party risk scores and concentration risk
- Incident frequency and severity of security, operational, compliance risks
- Loss events like financial or operational impact
- Risk velocity (how quickly a risk can materialize)
- Control gaps linked to high-risk areas
Compliance metrics
These indicate how well you adhere to regulatory obligations, legal requirements, and applicable frameworks. Compliance metrics to evaluate:
- Control effectiveness rate (pass/fail of control testing)
- Number of audit findings by severity
- Time to remediate audit findings
- Evidence completeness and availability
- Compliance coverage (controls mapped to regulations)
- Policy violation rates
- Certification status of legal frameworks
- Frequency of control execution (on-time vs delayed)
- Exception management metrics (open vs closed exceptions)
- Regulatory filing accuracy and timeliness
- Continuous monitoring coverage (automated vs manual controls)
- Repeat audit findings (indicator of control failure)
KPIs, KRIs, and KCIs – the performance thresholds explained
Measuring performance is all about the numbers. Getting it accurate depends on using a precise method; key indicators.
Broadly divided into three categories, these help in tracking GRC progress and make aids in decision making.
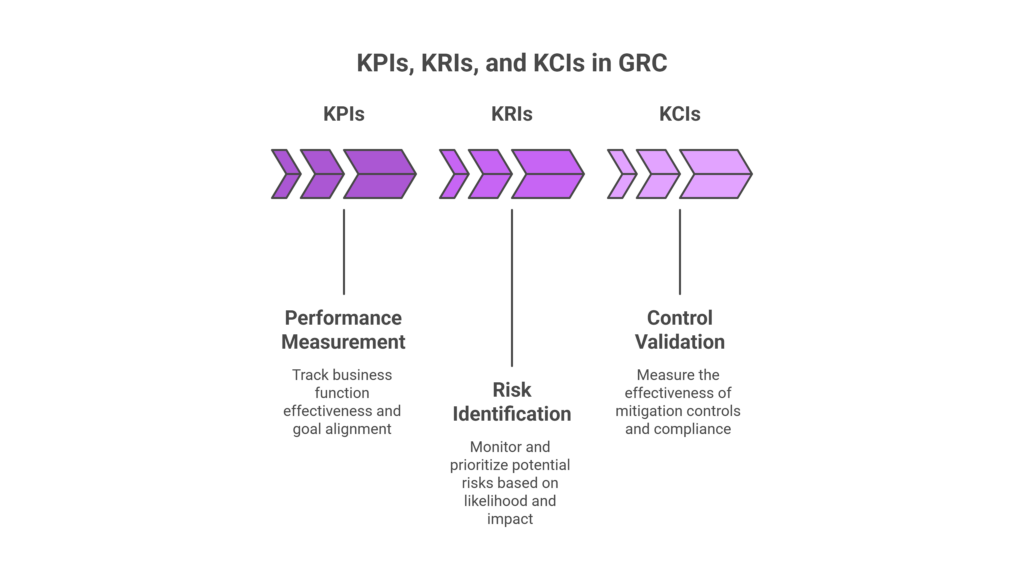
Key Performance Indicators (KPIs)
KPIs measure the effectiveness or success of your business functions in meeting the goals. In the context of GRC, they track outcomes like audit cycle time, remediation closure rates, or policy adoption. The core function of KPIs boil down to 1) performance efficiency and 2) alignment with business goals.
Key Risk Indicators (KRIs)
These focus on the level and likelihood of risks. These are calculated based on indicators like access violation occurrences, overdue control reviews, vendor risk scores, and more.
Unlike KPIs, KRIs are somewhat predictive in nature; they identify vulnerabilities and prioritize them based on impact levels.
Key Control Indicators (KCIs)
KCIs measure the effectiveness of controls; if they are functioning as intended. It bridges the gap between compliance and risk by validating if the mitigation mechanisms are working correctly.
Putting the GRC metrics in practice
Understanding how GRC metrics work is step one. Squeezing the maximum ROi out of your GRC program means turning the data into actionable insights. This means embedding them on an operational level.
1. Align metrics to business objectives
A common mistake management makes in designing metrics is setting them up solely around compliance requirements. To get the most of your GRC program, map your metrics to measurable business priorities instead of treating it as a standalone compliance indicator. The starting point is to define what each priority means;
- Revenue protection → metrics tied to downtime, failed transactions, or delayed deal cycles due to compliance gaps
- Operational resilience → control uptime, incident response time, and system recovery metrics
- Regulatory exposure → audit findings, control failure rates, and remediation timelines
- Strategic risk → metrics around vendor dependency, data concentration, or emerging risk indicators
Next, map these controls to outcomes. For example, access control effectiveness impacts data breach risk, which in turn impacts revenue.
2. Define metrics at the control and process level
High-level metrics like “number of audit findings” lack diagnostic value. Effective programs break metrics down into control-level and process-level indicators. For example:
- Control effectiveness metrics validate whether a control is consistently executed and producing expected outcomes.
- Process metrics measure how efficiently issues are detected, escalated, and resolved.
A layered approach like this allows teams to trace outcomes back to specific operational gaps.
3. Prioritize leading indicators
Lagging metrics confirm failures after they occur. Leading indicators, on the other hand, signal where failure is likely.
These may include delayed control execution, unusual access patterns, or increasing exception volumes. Focusing on these signals helps teams to intervene before risks turn into incidents or audit gaps.
To prioritize lead indicators, trace signals that occurred before a failure. For example, delayed access reviews or ignored alerts that resulted in unauthorized sharing. In addition, keep track of anomalies in user activities, unresolved risks, or overdue reviews.
4. Automate data collection and validation
Manual data collection results in inconsistency, errors, and eats up IT bandwidth, ultimately impacting the metric quality.
In contrast, mature GRC programs integrate directly with operational systems such as identity platforms, cloud environments, and ticketing tools. Doing so continuously updates, verifies, and audit-readies metrics with little to no effort.
For example, a GRC platform like Cura eliminates manual data gathering by integrating directly with operational systems such as IAM tools, ticketing platforms, cloud environments, and audit systems. It automatically ingests, normalizes, and maps to the right controls and metrics. This ensures consistency, audit-ready evidence, and a single source of truth.
5. Implement thresholds and decision triggers
Define predefined thresholds that trigger specific actions. For instance, a spike in failed control tests automatically initiates a remediation workflow or escalates to management. This will help you embed metrics into operational processes rather than existing as static dashboards.
Implementing thresholds also ensures consistent responses, accelerates remediation, and prevents low risk vulnerabilities from snowballing to incidents.
6. Enable drill-down and root cause analysis
While executives need aggregated views, operational teams require the ability to investigate. The ability to drill down on incidents helps to set up preventive controls and generate right evidence for auditors.
Metrics should support drill-down into underlying data such as affected systems, users, or controls and provide historical context. In the long term, this helps teams move from symptom identification to root cause resolution.
7. Continuously refine metrics based on outcomes
GRC environments are dynamic, and metrics must evolve accordingly. Regular reviews should incorporate learnings from incidents, audit findings, and process changes. Metrics that are not updated over time lose relevance and fail to reflect the organization’s actual risk posture.
Cura: the one in all GRC metrics analysis platform
Cura enables organizations to track and analyze GRC metrics by turning fragmented data into centralized, actionable insights.
At the core is a unified platform where governance, risk, and compliance data from controls, audits, incidents, and policies is consolidated into a single source of truth. This eliminates reliance on spreadsheets and siloed systems to ensure metric consistency and reliability.
Cura’s configurable dashboards allow teams to monitor key metrics in real time, such as risk exposure levels, control effectiveness, audit findings, and compliance status. These customizable dashboards enable different stakeholders, operational teams, risk managers, or executives to view metrics that matter most to their role.
The platform also supports automated data collection and workflow-driven updates. As controls are executed, audits are completed, or incidents are logged, relevant metrics are updated automatically. This ensures continuous visibility rather than point-in-time reporting.
For deeper analysis, Cura enables trend tracking and drill-down capabilities. Teams can identify patterns such as recurring control failures, increasing risk scores, or delays in remediation, helping them move from observation to root cause analysis.
Importantly, Cura links metrics directly to underlying controls and processes. This means teams don’t just see what is happening they understand why it is happening and where to act.
Using real time visibility, customization, and traceability, Cura helps organizations shift from static reporting to data-driven decision-making across their GRC programs.
Leave a Reply